CARD RE-DESIGN: ESRI LIVING ATLAS

The Team: Myself
The Timeline: 40 hours
The Challenge: Discover the optimal card layout for GIS savvy users
Good work brings more work
After a round of user research and design on Esri’s open source GIS page, The Living Atlas, I discovered users wanted to have multiple views while searching for content. I was surprised when esri came back requesting another round of design for page-views. They already had multiple card layouts and a list view on their existing tools. They wanted to find the optimal card and content layout. Game on.


Initial Thoughts
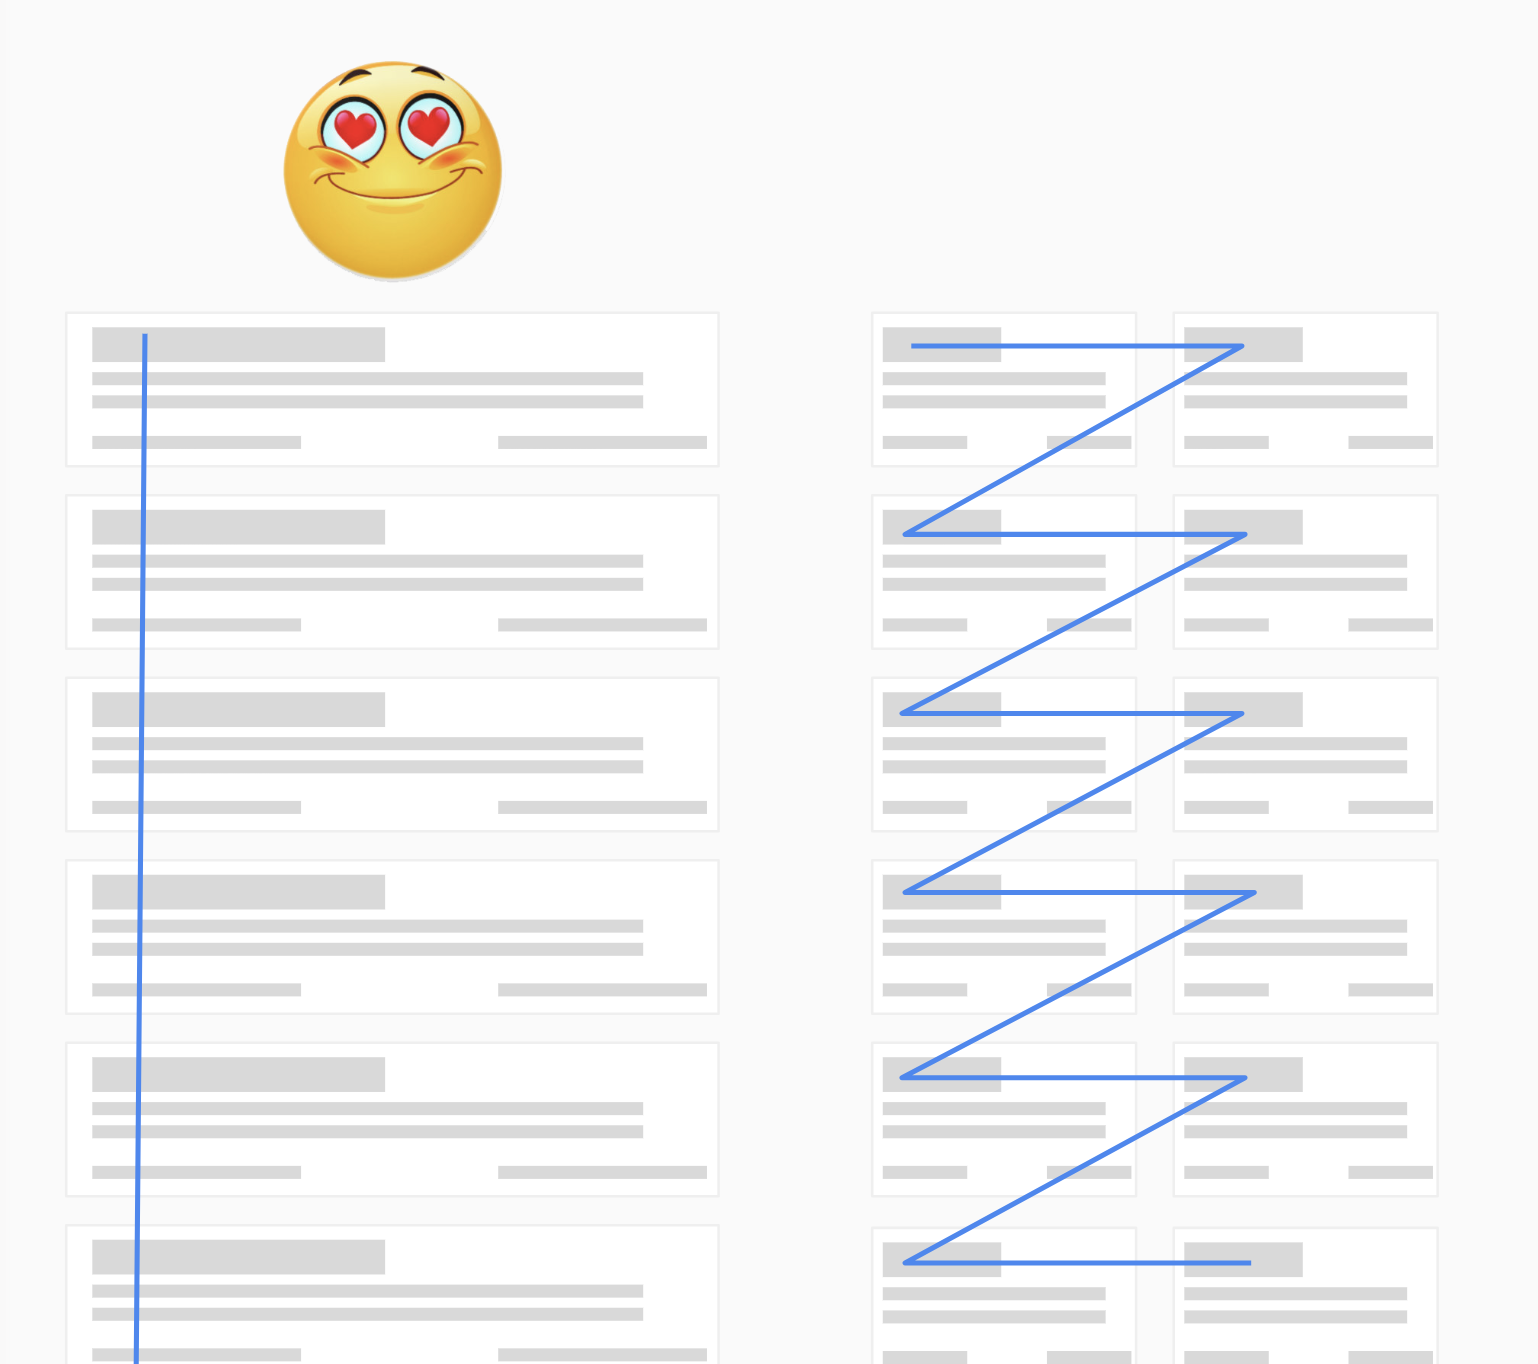
I was reminded of a talk by Hagan Rivers I went to a few months earlier. She was sharing take-aways on taking large enterprise tools with robust data tables and moving them from desktop to mobile view. One of the most successful and widely used patterns they utilized was the list view; where items are stacked vertically and utilize visual hierarchy to increase scan-ability. I started to see it everywhere since that day.

screenshot from Hagan Rivers Talk: Fitting an Elephant into a teacup
I also remembered a vertically-stacked card on a product that that had great scannability, which brought me to my hypothesis: People can find information faster and will be happier with vertically-aligned card content.

Hypothesis
People can find information faster and will be happier with vertically-aligned card content.
but first: strategy
Since I only had a week to - create new designs, recruit testers, test card layouts, synthesize results and produce recommendations - I knew I had to be incredibly efficient with only one shot for user testing. I decided to have the users perform one task per card-design and test for speed and accuracy.
variable reduction
I can't ask the same question for each layout. That would skew the data because people will get better by the time they get to the last one. This would skew the results.
I also can’t just ask a different question per layout, what if one of the questions is confusing? That would also skew the data.
In addition I needed to know whether or not these new designs performed better or worse than the original design. Therefore, the current design must be incorporated as a baseline.


The solution: Test a combination of easy and hard questions, 1 of each per card-stye. In addition, I decided to flip-flop the questions for 1/2 of the test group. This way the you could see how the same question performs on a different layout. I included the current card layout (A) to see how it measures up to the new configurations.

The Qualifiers
I found out the majority of the Living Atlas users are intermediate to advanced GIS users. Frequency of searching for content in ArcGIS is a tell-tale answer that helped me gage what level of GIS user I was working with. With the majority of the testers in the intermediate-advanced GIS user range, I felt confident I had a good test-group for the job.
results
The vertically-aligned cards had higher accuracy marks across the board.
In the spreadsheet here you can see the correct answers highlighted in green. Card A and card D had the same combination of questions and layout D had significantly better accuracy results. Although Card-A had a better average time it had the worst accuracy. I noticed that people were getting overwhelmed and just blurting out an answer as opposed to taking their time to analyze the cards and think through the task at hand.

ok, but what do the people want to look at?
I also wanted to get a temperature check on the overall layout. I asked each user to select a favorite layout and explain why they liked it. Layout B (Long Card with Detail) was the preferred layout. This was reassuring to see however I wanted to double check that Esri's target-users were being considered. I took the users and gave them a number according to their GIS experience and added up the results. Interestingly, the weighted vote results were almost identical. Layout B was the intermediate/advanced GIS-user favorite.

The Popular Vote and Weighted Vote had almost identical results

They like it, they really like it!
I have a general dis-trust when my hypothesis turns out to be true. However, I took quite a few measures to ensure the results were being looked at from many angles with intermediate/advanced GIS users in mind. Therefore, I feel confident in the results. I did however think that Layout D was going to be the highest performer and overall crowd pleaser. So there's some comfort in being wrong about that.
The favorites


People that preferred Layout B said:
“I like having the description content”
“Vertical alignment and large thumbnail”
“It’s easier to compare different items”
“It’s easy and natural to compare a long list vertically”
People that preferred Layout C said:
“Looks more Attractive”
“More content before you have to scroll”
“Good use of page real-estate”
“It is clear, I like the grid, everything is easily recognizable”

Things Learned
One thing that came out in the qualitative portion was that: there is a difference between what people want in a layout for browsing and what they want while searching for content. As a result I recommended to esri that they use Layout C (2 Column Long Card) for the default view and the Layout B (Long Card with Detail) as the alternate view as well as the classic list view.
If I had to do it all over again I think I would ask the four questions in rotating order with each tester. This approach may reduce variables more effectively than my direction.
Thanks for taking the time to follow me through my thought process. Have a look on Living Atlas and see my work in the wild.